 Read time 2 min
With raid adoption of new and smart property technology solutions the real estate industry is now inundated with a variety of raw data. There is no doubt that this inexhaustible source of data has incredible potential to drive significant business growth. However, there is a huge disconnect. Even though developers, property management companies and investors now have access to a wealth of data they are often frustrated with the difficulty of harnessing it into actionable insights.
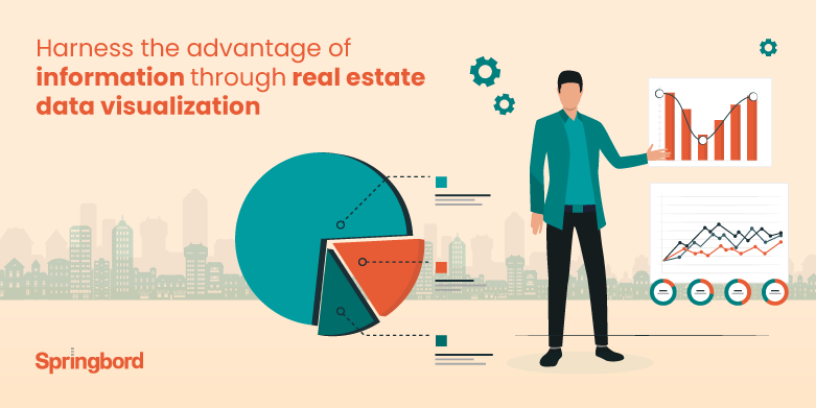
Some of the key issues facing industry players are – how to track and uncover hidden patterns – and leverage this information for driving profitable outcomes. Data visualization can help address this challenge. It plays a critical role in harnessing big data. Visualization allows you to extract value from unstructured and raw data and transform it into comprehensible and meaningful information that can drive dramatic results across business domains.
As witnessed in other industry sectors, data visualization can deliver unparallel benefits for the real estate industry as well. Let’s look at some of the key advantages you can gain through real estate data visualization.
Unearth correlation between operations and outcomes
Visual representation of data helps uncover and understand the exact relationship and dependencies between operations and business performance. Such patterns allow you to not just comprehend specific interdependencies and correlations but also extract meaningful insights, which otherwise would have been impossible to derive using unstructured data.
Armed with such useful information you can improve and optimize business functions in a focused manner that can in turn help improve market performance which is key to surviving in an aggressively competitive environment.
Identify and embrace new market trends
With the increasing application and use of virtual reality and 3D technology in real estate marketing, the amount of consumer behavior data that can be captured is inexhaustible. Through accurate visual representation of these data marketers can gain invaluable insight into prospects’ behavior and expectations.
By using data visualization consistently, you can capture, process and uncover key patterns and indicators, analyze the information to identify new trends and evolving market demands. Access to such information not only helps keep pace with and tap into newer opportunities but deeper understanding of customer enables you to create more targeted, contextual and relevant marketing strategies.
Reduce risk and optimize productivity
There is no doubt that you have a well-defined business vision/mission, however, it demands development of relevant strategies that can help achieve those goals. With data visualization, you can process incredible amount of data from across business domains and turn it into visual representation with drill down abilities. Such visibility helps reduce business and financial risk, identify growth opportunities, optimize productivity and operational transparency, and above all better engage with prospects.
Data visualization enables you to realize the potential of data assets, facilitate well-informed decision making, and promote more focused strategic planning. Accurate and efficient visual representation of data guarantees bigger and better results.
Realize the untapped potential of your business data with Springbord’s comprehensive real estate data visualization services. Talk to us today to find out how we can help you dig into newer opportunities and uncover meaningful patterns to your advantage.


